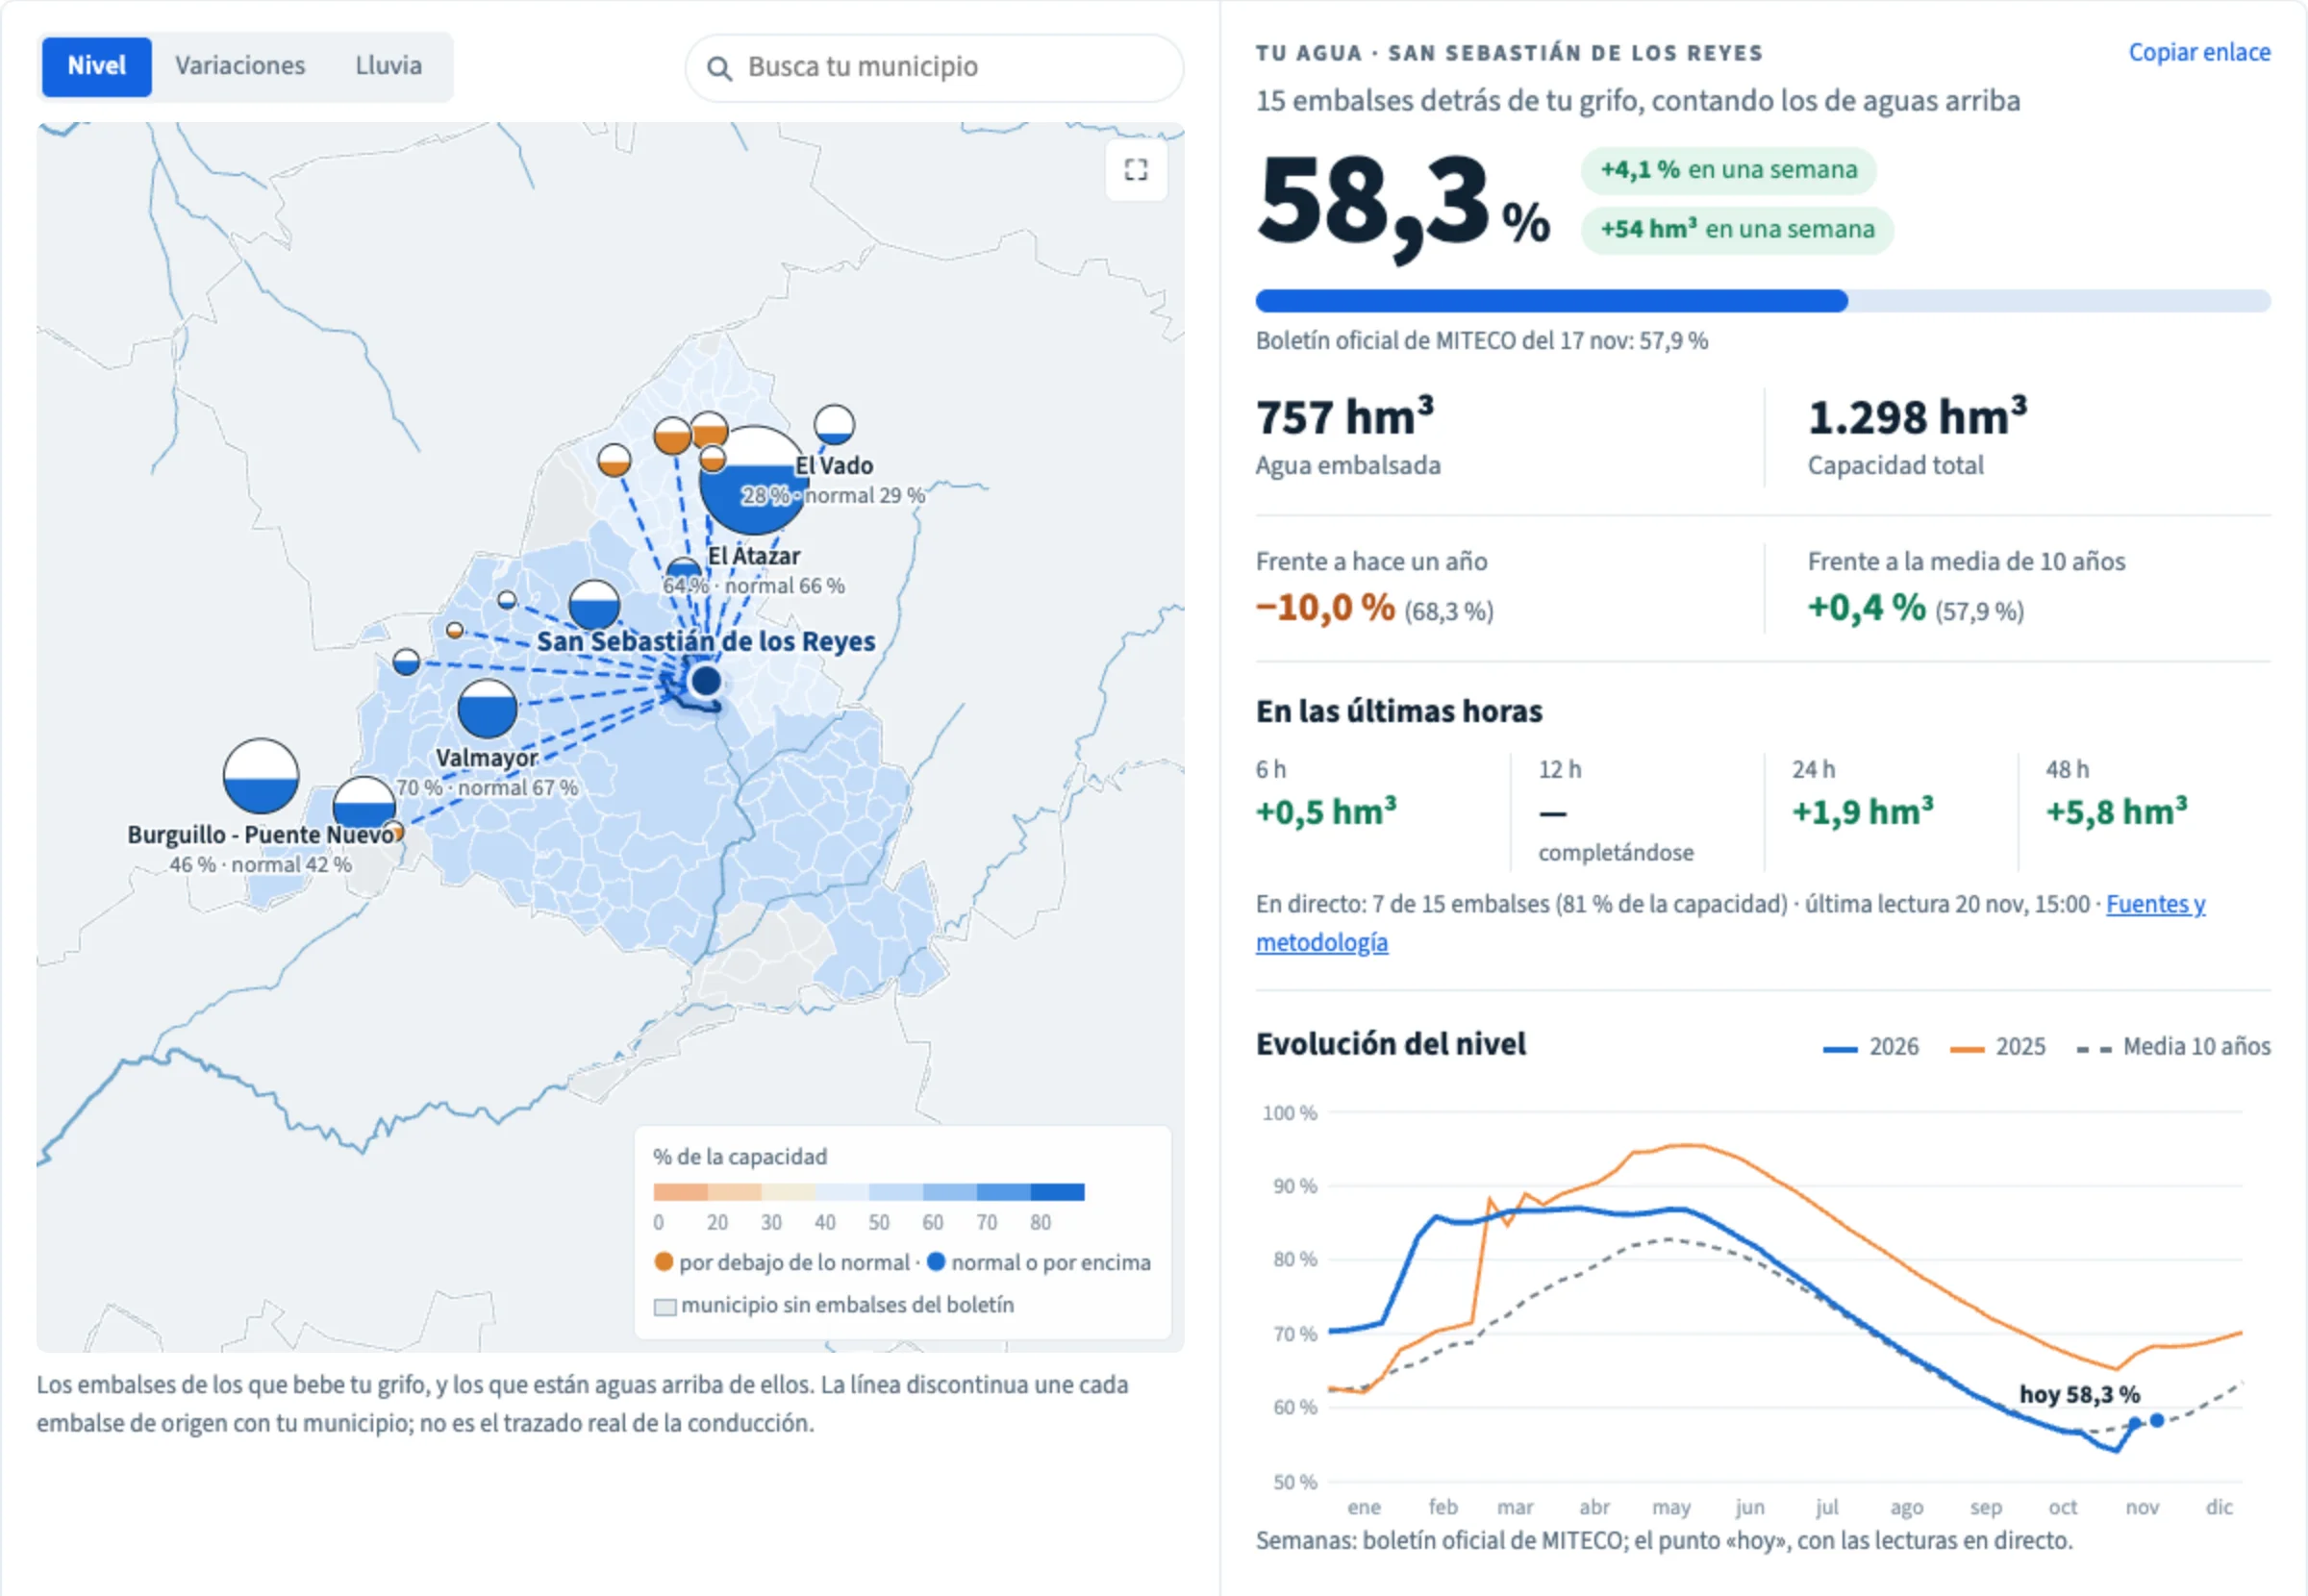
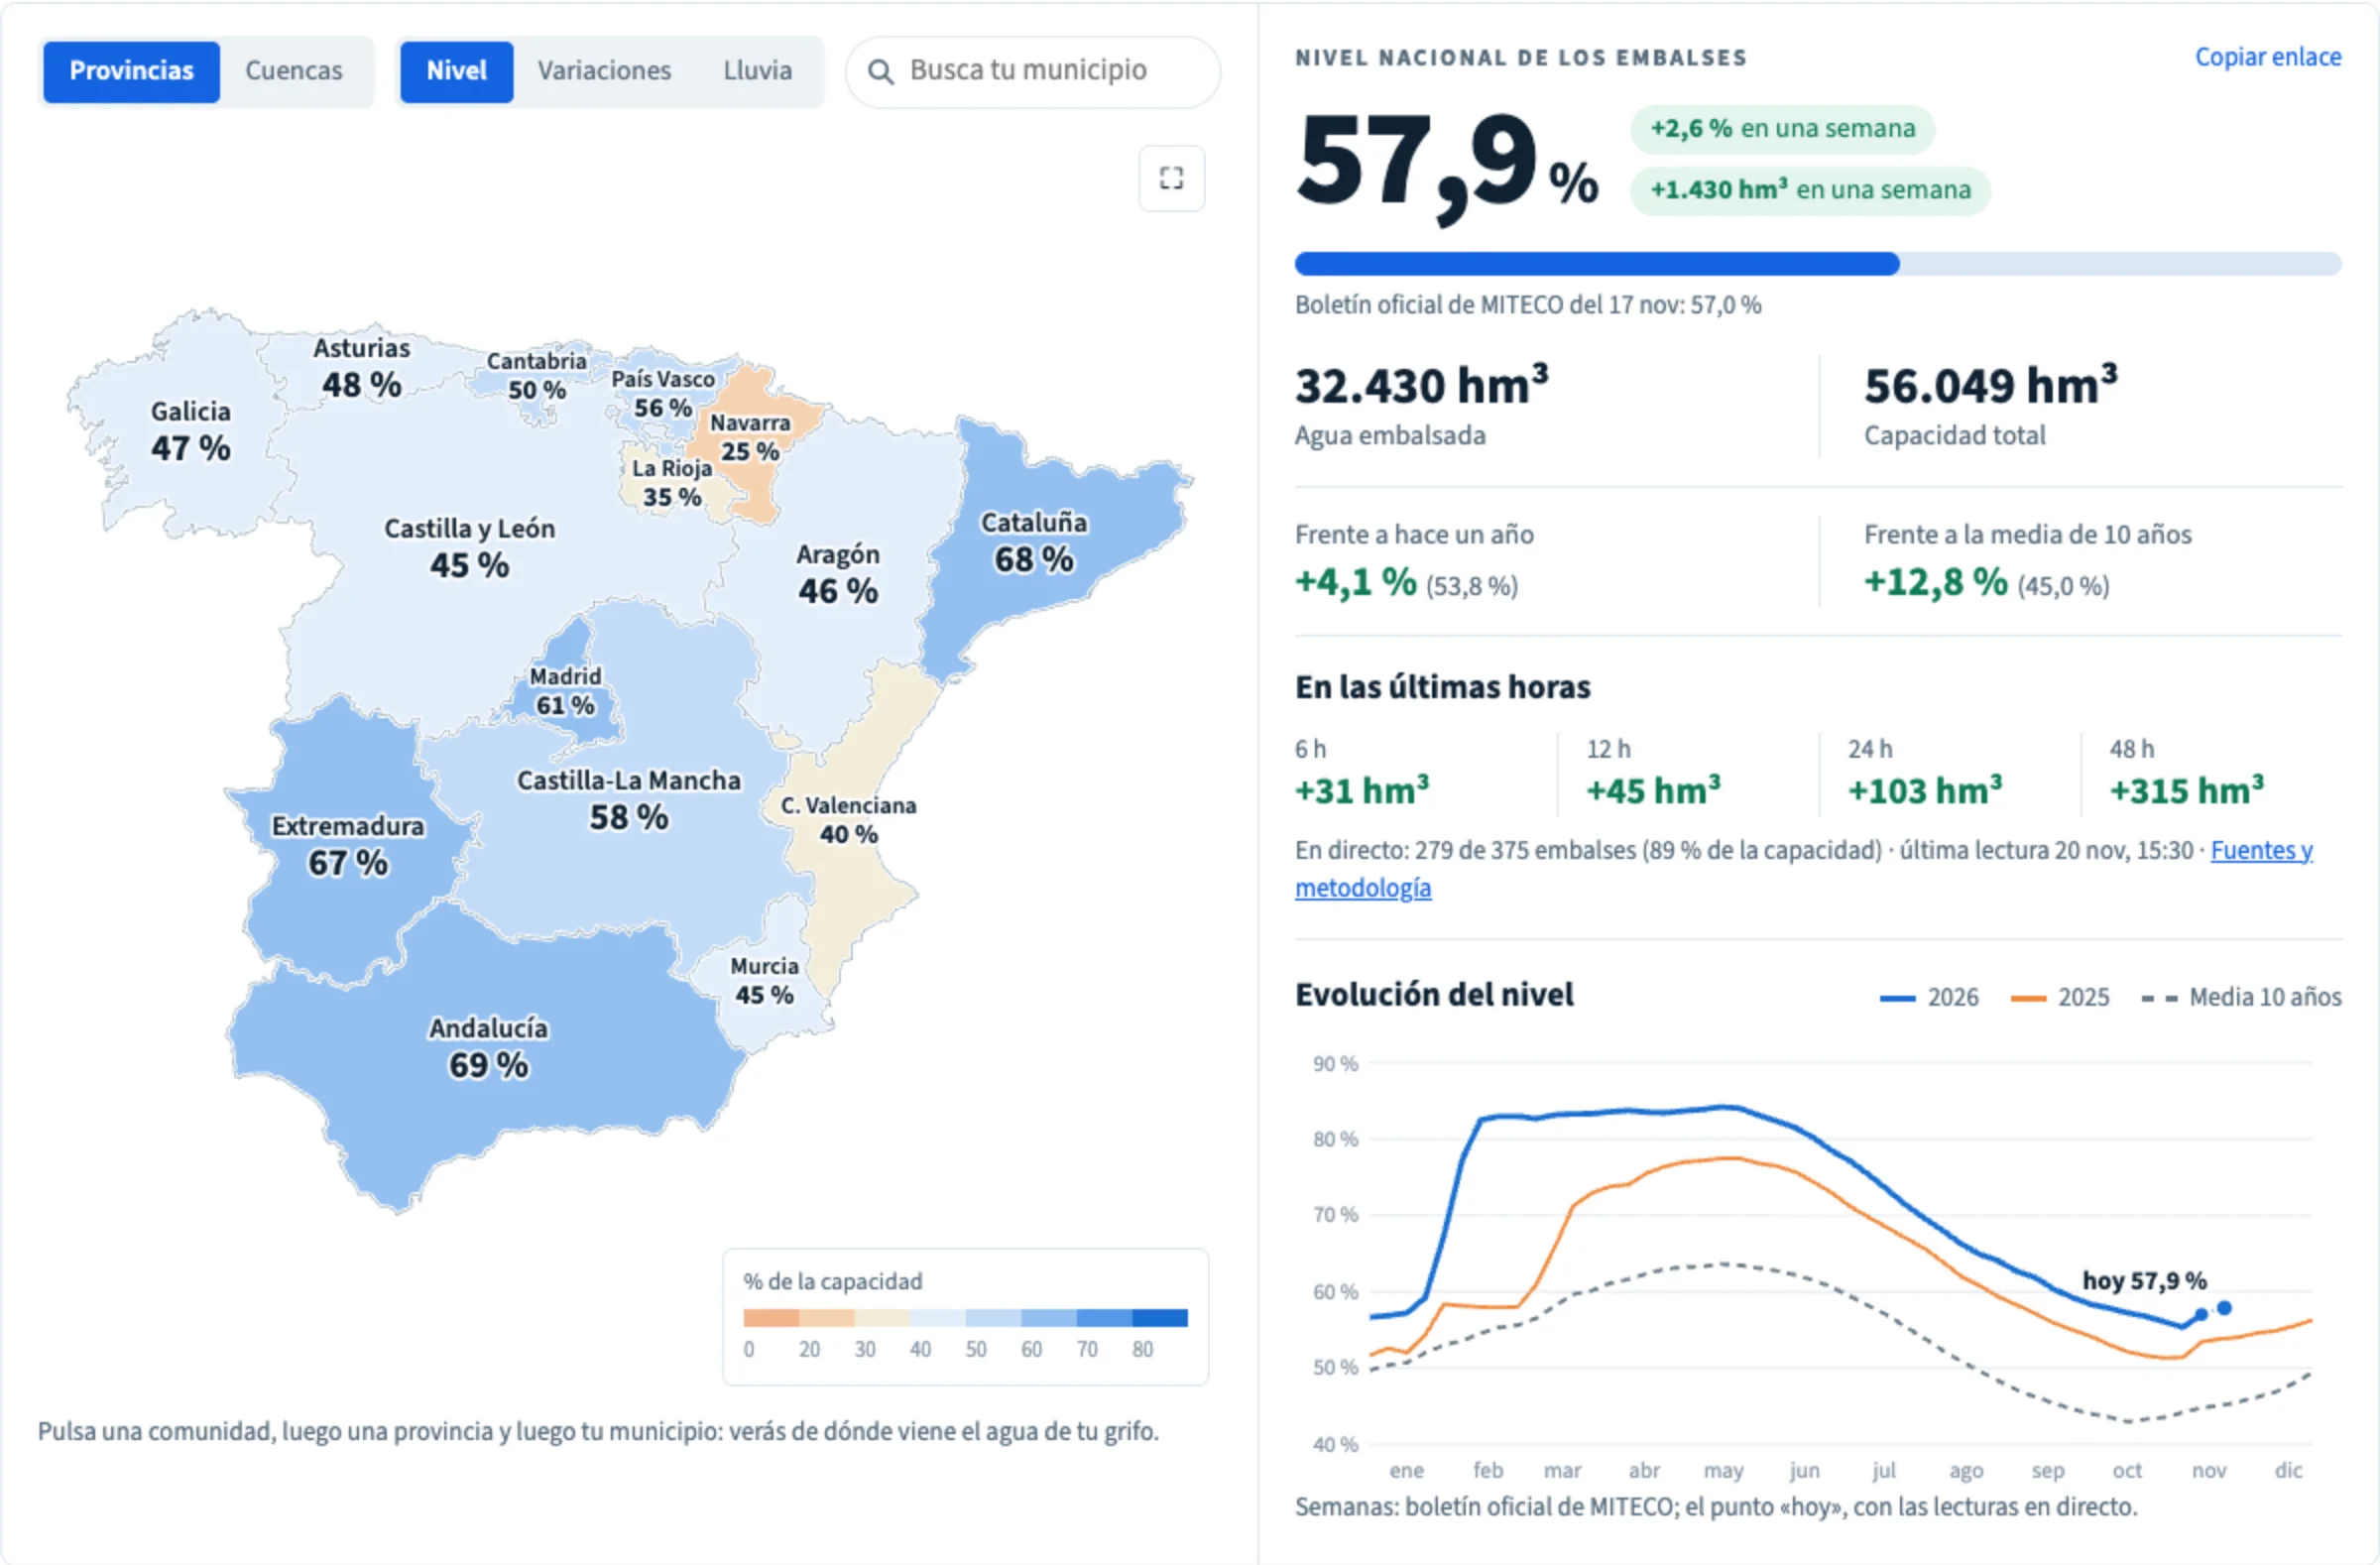
Spain publishes the level of its reservoirs once a week. Every Tuesday the Ministry for the Ecological Transition (MITECO) puts out a bulletin with all 375 of them. If it rains on a Wednesday, you find out what that did to the reservoirs six days later.
The river authorities know much sooner. Each one runs its own monitoring network, called a SAIH, that measures its reservoirs every 15 minutes or every hour and shows them in a public viewer. There are nine such authorities, plus the regional ones in Andalusia and Catalonia, and every viewer is built differently.
Projects like this one have always been hard. A dozen sources, each with its own format, its own quirks and nobody to call when it changes. Traditionally that means a pipeline per source, servers to run them, a scheduler, alerts, and data engineers to build it all. Building it is the easy half. Keeping it working is the hard one: the sources change without notice, the pipelines break one by one, and many such projects end up quietly abandoned.
We wanted all of them in one table that anyone can query, built by an AI coding agent working with one person. Ten days later, 279 of the 375 reservoirs are live, holding 89% of Spain's reservoir capacity. When it rains, the page shows the reservoirs rising within the hour. Each source is a single SQL query that LakehouseBox runs on a schedule. There is no server, no worker and no cron job anywhere in the project.
One source, one query
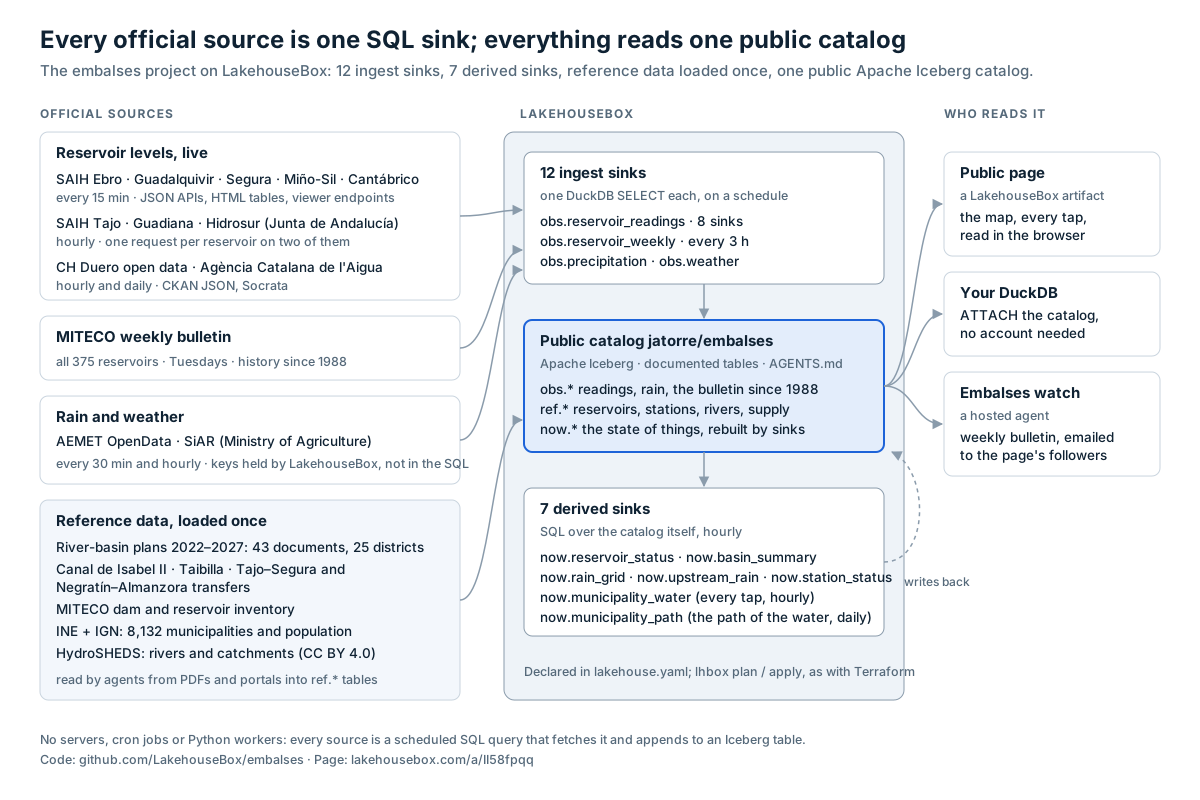
In LakehouseBox, scheduled SQL is a DuckDB SELECT that runs on a schedule and appends what it returns to an Iceberg table. The query can fetch the web itself with http_get and http_post, and parse what comes back with DuckDB: JSON, HTML with regular expressions, CSV. The platform keeps the schedule, retries, records every run and commits the rows. The project only has to say what to read.
Here is the kind of variety that has to fit in one SELECT. The figures are the medians of the recorded runs.
| Source | What the query reads | Every | Requests | Time | Live reservoirs |
|---|---|---|---|---|---|
| SAIH Ebro | JSON from the viewer's 22 zone maps | 15 min | 22 | 6.3 s | 56 |
| SAIH Guadalquivir | HTML, one map page per province | 15 min | 4 | 5.0 s | 44 |
| SAIH Segura | a form POST that answers JSON | 15 min | 1 | 0.5 s | 12 |
| SAIH Miño-Sil | one HTML page | 15 min | 1 | 0.8 s | 18 |
| SAIH Cantábrico | a WordPress form POST that answers an HTML table | 15 min | 1 | 0.4 s | 13 |
| SAIH Guadiana | one request per reservoir | 1 h | 41 | 31 s | 30 |
| SAIH Tajo | a chain of tokens, then one request per reservoir | 1 h | 58 | 25 s | 42 |
| Hidrosur, Catalonia (ACA), CH Duero open data | an HTML table, Socrata, CKAN, in one query | 1 h | 2 | 0.8 s | 64 |
| MITECO weekly bulletin | the bulletin's map service, all 375 reservoirs | 3 h | 2 | 0.4 s | the rest |
| AEMET rain and weather | the national weather service's open data | 30 min | 2 each | 1.4 s | |
| SiAR | the agriculture ministry's weather stations, daily rain | 1 h | 1 | 3.3 s |
The Tajo viewer is the hardest. Each of its calls carries a token handed out by the previous one, so the query walks the same chain the viewer does: the home page, then the menu, then the list of stations, then one call per reservoir. In SQL that is a chain of common table expressions, each one fetching the URL that the one before it found:
WITH
home AS MATERIALIZED (
  SELECT regexp_extract((http_get('https://saihtajo.chtajo.es/')).body,
                        'index\.php\?w=get-wrapperentorno&x=[^"'' ]+', 0) AS u
),
wrapper AS MATERIALIZED (
  SELECT (http_get('https://saihtajo.chtajo.es/' || u)).body::JSON -> 'response' ->> 'urlmenu' AS u FROM home
),
-- … the menu, the station list, then one http_get per reservoir
Fifty-eight requests and 7.7 MB downloaded, every hour, in about 25 seconds. All twelve ingest queries together are 532 lines of SQL, comments included, and every one is public.
We read the same public pages that the official viewers show, at the pace the sources update, and every source is credited on the page. Every reading is marked provisional, as the authorities mark it themselves.
A language agents write well
Every query in this project was written by an AI coding agent, with a person reviewing and deciding. That is the other half of our approach: not only does the integration run as SQL, it is built by agents, and SQL is what makes that work. A query is short, declarative and one file per source. Current models write it very well, and a person can read the whole of it in a minute and see exactly what it fetches and what it keeps.
Most of the work was finding out what a viewer actually serves. lhbox sink preview runs a query once, on the platform, and shows the rows it would write, without writing them. That gives the agent a tight loop: read the viewer, write the query, preview it, look at the rows, fix, preview again. That loop is how each source was built. The whole project, the page included, is 92 commits over ten days.
The Ebro is the clearest case. The viewer's whole-basin map shows only its 12 largest reservoirs. Its 21 zone maps, one per part of the basin, show the rest. One preview query that tried all the zone names took the Ebro from 12 to 69 reservoir stations. The sink now reads all 22 maps in about six seconds.
Declared like infrastructure
Nothing was set up by hand. The project's lakehouse.yaml declares the catalog, its tables and every sink with its query file and schedule. lhbox plan shows what would change and lhbox apply makes it so. In the repository, a merge to main runs both, and the migrations that create or change tables. If you prefer Terraform, the same resources are there too.
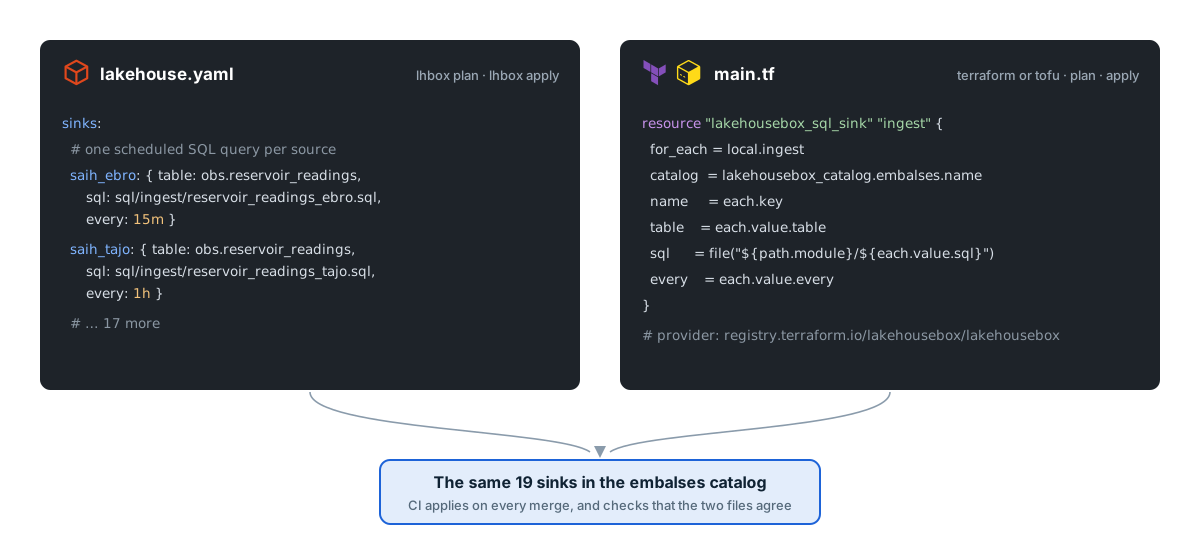
The plan earned its keep early: it found a sink that existed in the catalog but not in the repository, the SiAR rain. It is in the repository now.
Tables that rebuild themselves
Raw readings are not what a page or a person wants. They want the state of every reservoir now, against last year and against the last ten years, and the rain that fell upstream of it. Seven more scheduled queries read the catalog itself and rebuild those tables every hour: now.reservoir_status, now.basin_summary, now.upstream_rain and others. Each run replaces its table whole, and each has a floor (min_rows): a run that would leave now.reservoir_status with fewer than 300 rows is refused, and the old table stays.
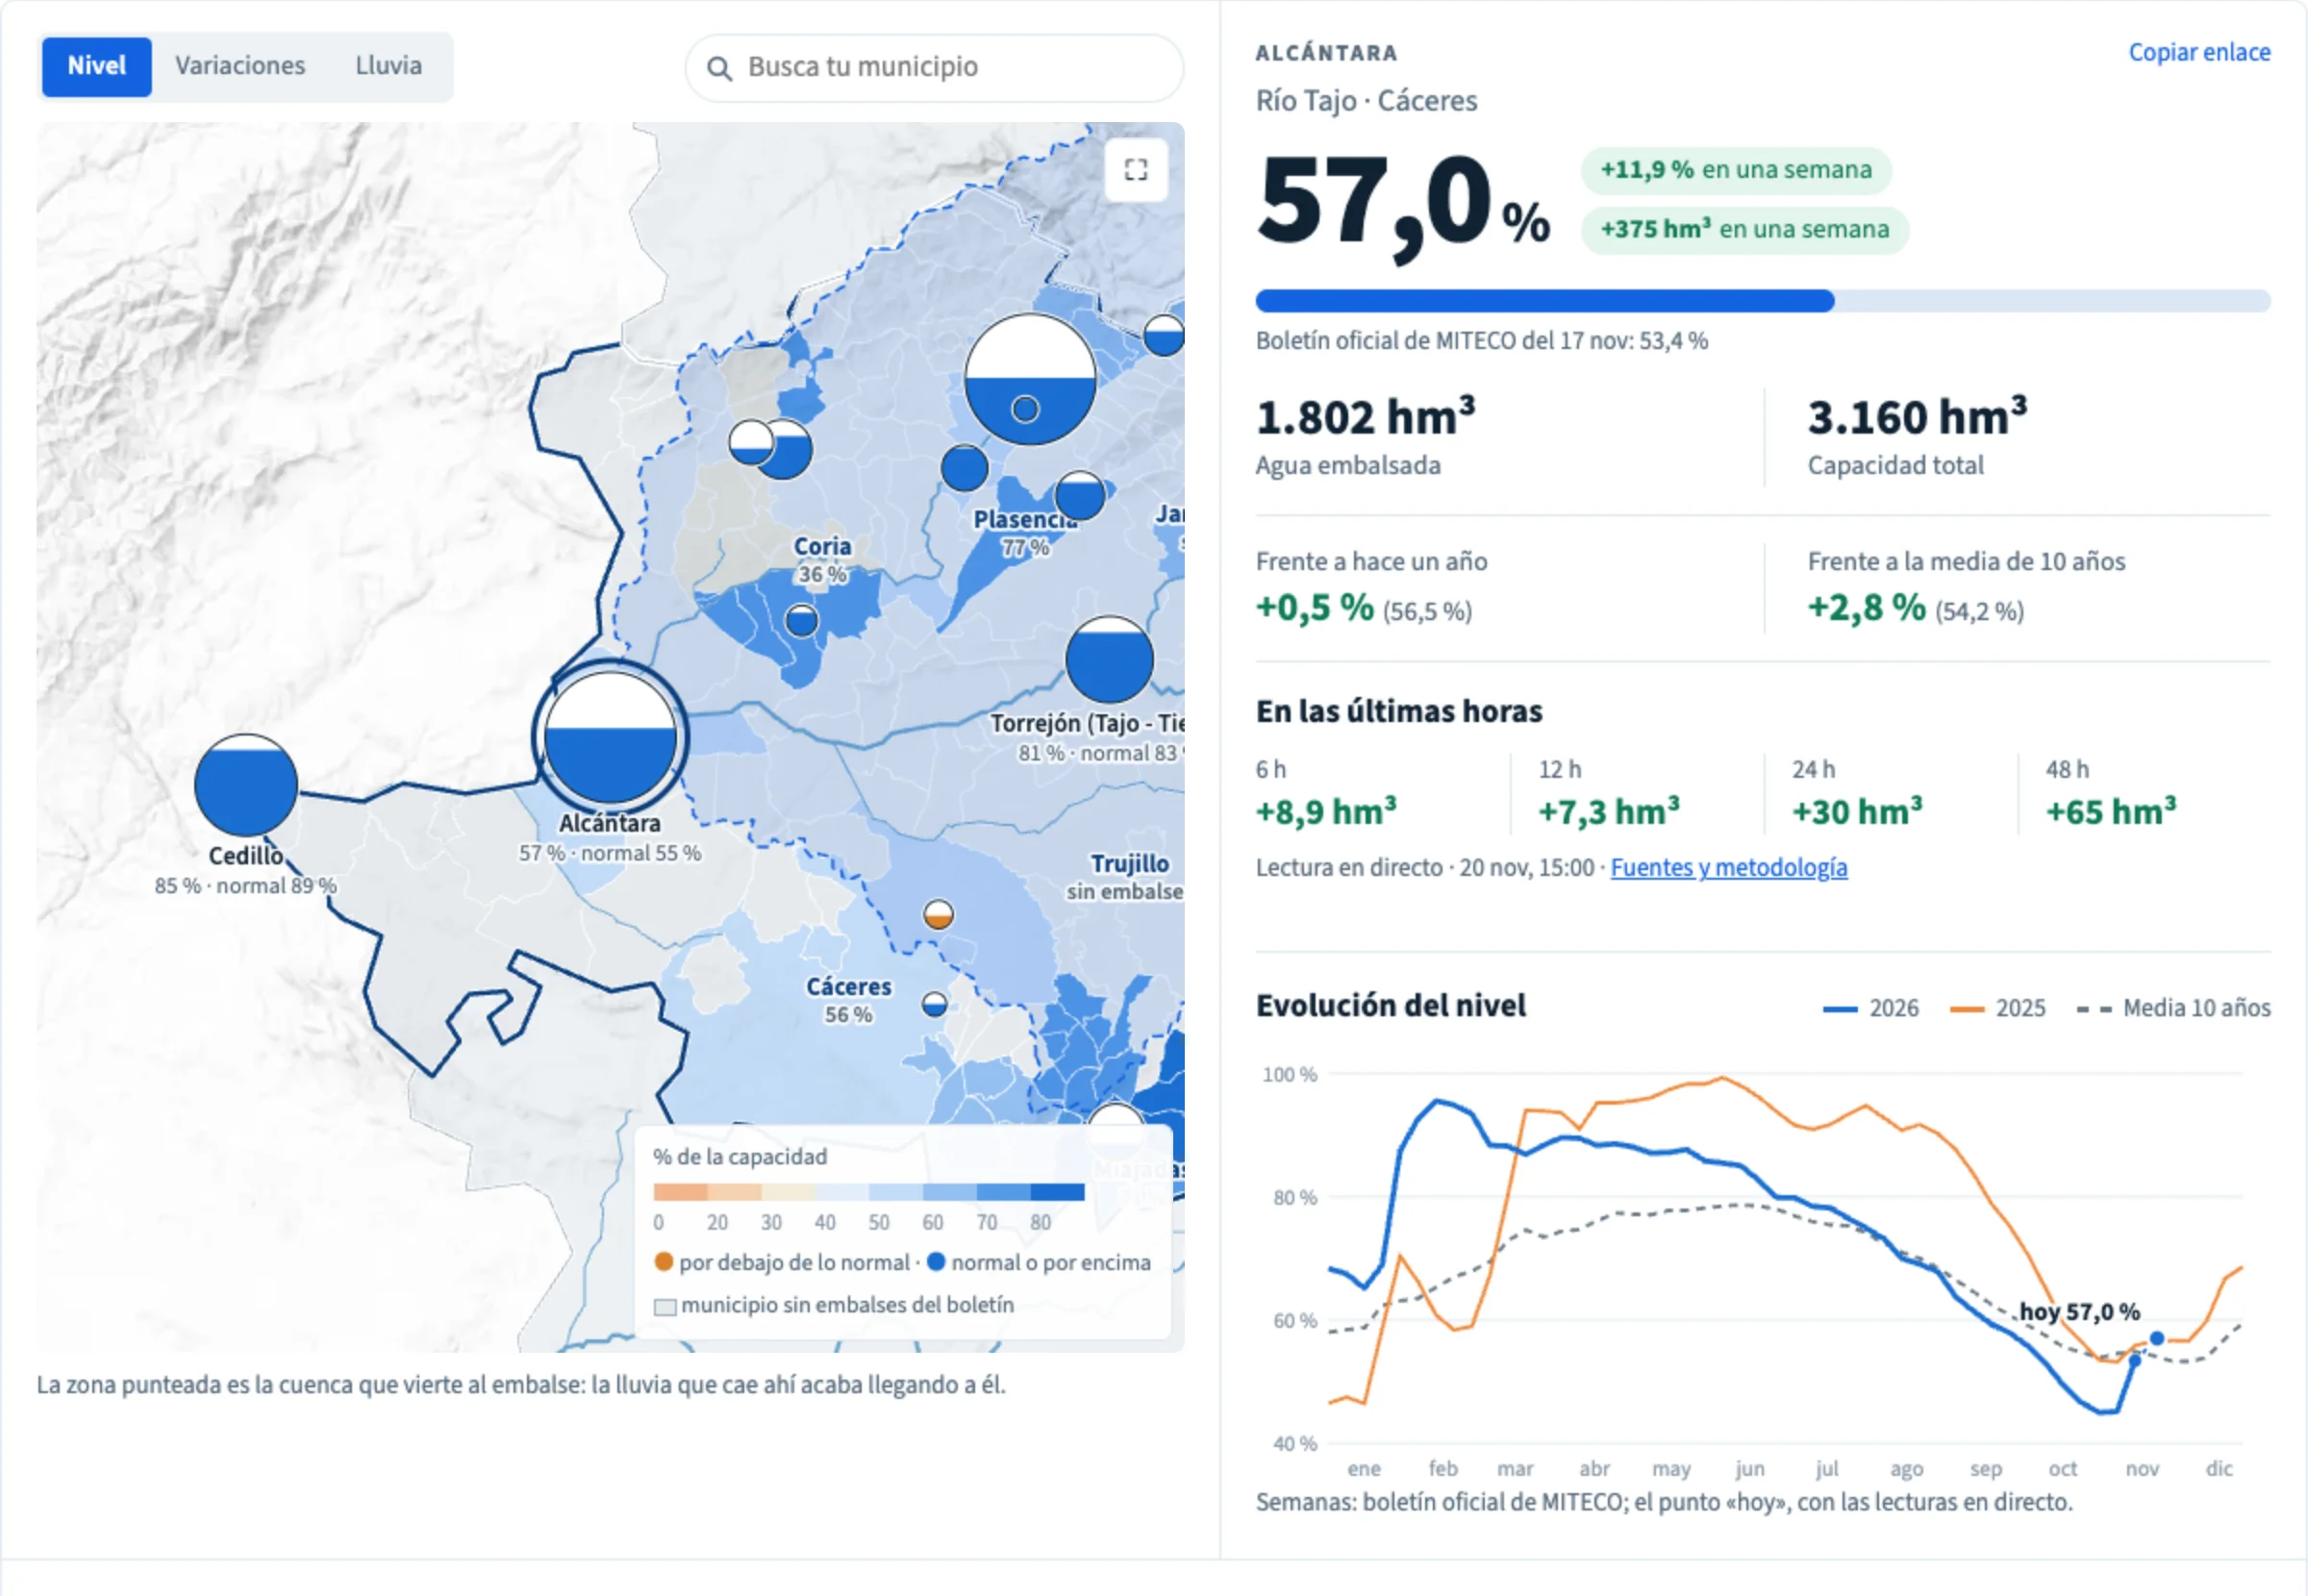
The public page, a hosted agent that writes a weekly bulletin for the page's followers, and anyone with DuckDB all read those same tables:
INSTALL iceberg; LOAD iceberg; INSTALL httpfs; LOAD httpfs;
ATTACH 'jatorre/embalses' AS embalses (TYPE iceberg, ENDPOINT 'https://public-catalog.lakehousebox.com', AUTHORIZATION_TYPE 'none');
SELECT reservoir_name, fill_pct, change_24h_hm3 FROM embalses."now".reservoir_status ORDER BY change_24h_hm3 DESC LIMIT 5;
No account and no key. The catalog also serves a guide for AI agents with every table, its units and its caveats.
When the data argued back
Loading the data was the easy part. Checking it is where most of the time went.
- The bulletin was the stale one. CH Duero's open data put Santa Teresa at 345 hm³. The weekly bulletin said 221. We first trusted the bulletin and kept three Duero reservoirs off the live feed. Then we looked again. The bulletin was a week old, and that week Santa Teresa had risen 118 hm³. The open data was right.
- The bulletin can be late. The bulletin of Monday 17 November was still not on MITECO's map service the next morning. Our first query only kept the newest day's bulletin, so a late one was missed for good. It now takes any bulletin under eight days old, and a bulletin sent twice replaces itself.
- Not every clock is Madrid's. Catalonia's water agency publishes a time with every reading. On 29 March, the night Spain moves its clocks forward, there are readings at 02:00 something, an hour that does not exist in Madrid. Its times are UTC.
- Small sources drift. Today, while gathering the numbers for this post, the agent found that 25 of the Tajo query's last 73 runs had failed. Now and then one station answers
{}where a time should be, and one bad value failed the whole run. The fix is one word,try_strptimeinstead ofstrptime, and that station's value is skipped. The run history made the failure obvious, the error said where, and preview checked the fix. But it was found only because someone happened to look.
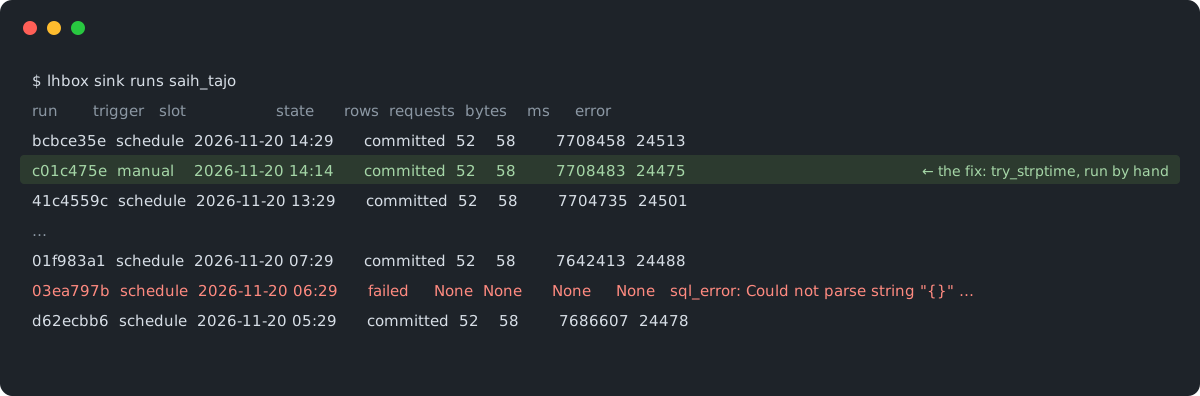
In the runs we looked at (up to the last 500 of each query, about five days for the 15-minute ones), the twelve ingest queries ran 3,594 times. Sixty-three runs found nothing new, as expected (the bulletin is weekly, SiAR's rain is daily). Of the rest, 98.8% wrote their rows. The failures were the Tajo times above, twelve AEMET answers that were not valid text, one moment when storage was unreachable, and four runs skipped because the previous one was still going.
What hurt
- Eight sinks per table, at most.
obs.reservoir_readingshas one sink per river authority, and that used up the eight. Hidrosur, Catalonia and the Duero share one query, so when one of them fails, all three miss that hour. - Preview has a 20-second budget. The full Tajo run takes about 25 seconds, so it cannot be previewed whole. We built it in parts and checked the whole run after it was scheduled.
The next data engineer is an agent
Building twelve integrations took ten days. Keeping them working is the cost that never ends: a viewer changes its HTML, a token chain gets one more step, a station starts answering {}. That is the work that has always needed a data engineer on call, and it is where projects like this one usually die.
So the second half of our approach is agents that repair, not only agents that build. This is what we are working on now, and it is not available in LakehouseBox today: an agent that does the data engineer's job on a catalog. It watches every sink's runs. When one starts failing or returning fewer rows, it reads the error and the source, writes a fix, previews it, and proposes it for review, or applies it where the owner has allowed that. When it cannot fix something, because a source is gone or a decision is needed, it says so to a person.
The Tajo failure above is exactly that job, done by hand: read the run history, read the error, change one word, preview, ship. Everything such an agent needs is already in the platform: every run, its error and its row count are recorded, the queries are short files it can read and change, and preview tests a fix without writing anything.
See it yourself
The page shows every reservoir, the rain over its catchment, the change in the last hours, and, for 35.7 million people, the reservoirs behind their own tap. The repository has every query, the declarations and the page.